

Bitcoin returned to positive territory on June 12 as risk appetite improved following signs of possible de-escalation between the United States and Iran.
Bitcoin traded at nearly $63,700 on June 12, up about 1% over 24 hours, according to market data crypto.news. The asset also gained 1.66% over seven days, showing recovery after the recent move below $60,000.
The rebound came after traders reacted to signs that tensions between the United States and Iran may be easing. President Donald Trump has canceled planned strikes against Iran and said a deal could be reached soon, according to reports.
Oil prices fell after this news. Brent crude fell in the mid-1980s, easing concerns that rising energy prices would keep inflationary pressure high.
This change is important for crypto because oil-driven inflation can keep the Federal Reserve hawkish. Less geopolitical tension can reduce pressure on risk assets, including Bitcoin and major altcoins.
Prices of Bitcoin and major cryptocurrencies rise
Ethereum traded near $1,671, up about 0.97% over 24 hours. The token remained near the $1,650 support zone after a week of weakness for Ethereum spot ETFs.
BNB was trading near $605, while Solana was hovering around $66.69 after a daily gain of 1.95%. XRP is also trading near $1.14, up 3% on the day.
Dogecoin traded near $0.086, while Hyperliquid rose to around $59.17. HYPE was among the strongest major tokens, although it remained weaker during the weekly window.
TRON was clearly lagging behind among the listed majors. TRX was trading near $0.312, down 2.86% over 24 hours and down 3.79% over seven days.
The broad rebound shows that traders have reduced their risk aversion positioning. This decision nevertheless remains early and has not yet erased the damage caused by the massive sale in June.
Options Data Shows Fear Has Calmed
Glassnode said Bitcoin fell below the February low before rebounding from the June low. The company monitored options traders’ reaction during the move.
“The sell-off triggers a temporary spike in volatility,” Glassnode said.
According to Glassnode, currency-implied volatility has surged as $BTC fell below the February low. One-week implied volatility briefly reached 65% before the peak faded.
The initial volatility then returned to almost 40%. This shows that options traders did not continue to anticipate a prolonged panic after the rebound.
“Markets still view selling as a contained move,” Glassnode said.
Demand for protection also grew rapidly before fading. One-week asymmetry increased from 12% to 28% $BTC fell, showing a downward cover rush.
This gap then returned to almost 12%. This reversal suggests that traders bought protection during the downside breakout and then reduced their coverage as prices stabilized.
ETF outflows keep pressure on Bitcoin
Spot Bitcoin ETFs saw $19.03 million in net outflows on June 11, according to SoSoValue data. This is the fifth consecutive day of capital outflows and shows that institutional demand remains cautious.
Spot Ethereum ETFs also saw net outflows of $15.89 million on the same day. This was the third consecutive day of withdrawals of ETH funds.
As previously reported by crypto.news, the June crypto crash was the result of several combined pressures. The market faced a hawkish Fed, an escalation in Iran, ETF outflows and an unwinding of leverage.
SpaceX’s IPO interest also created a flight of hot money, as previously noted. This report states that the IPO wave alone did not cause the crash, but that it weakened the crypto buyer base.
The latest rebound in Bitcoin must therefore compete with the current weakness of ETFs. If ETF flows turn positive again, the recovery could receive firmer support.
If the pullbacks continue, the rebound may struggle to move past the next resistance areas.
Traders monitor the FOMC and $60,000 support
Several analysts have nevertheless warned that Bitcoin’s rebound could face another test. Crypto Rover said the four-year cycle remains on schedule, with cycle lows historically arriving between September and October of the fourth year.
“The 4-year cycle is going according to plan,” Crypto Rover said.
THE 4-YEAR CYCLE TAKES PLACE AS SCHEDULE.
Each before $BTC cycle, aligned on a single graph.
Cycle tops: all printed in the same window.September-November of year 3.
Exactly where this cycle peaked at $124,000.Bottom of cycle: all printed in the same window. September-October of… pic.twitter.com/gGyktE7tLb
— Crypto Rover (@cryptorover) June 12, 2026
Kaz said Bitcoin reacted poorly to most FOMC events during the bear market. The analyst indicated that June 17 would be a possible date for another lower high if the price fails to extend.
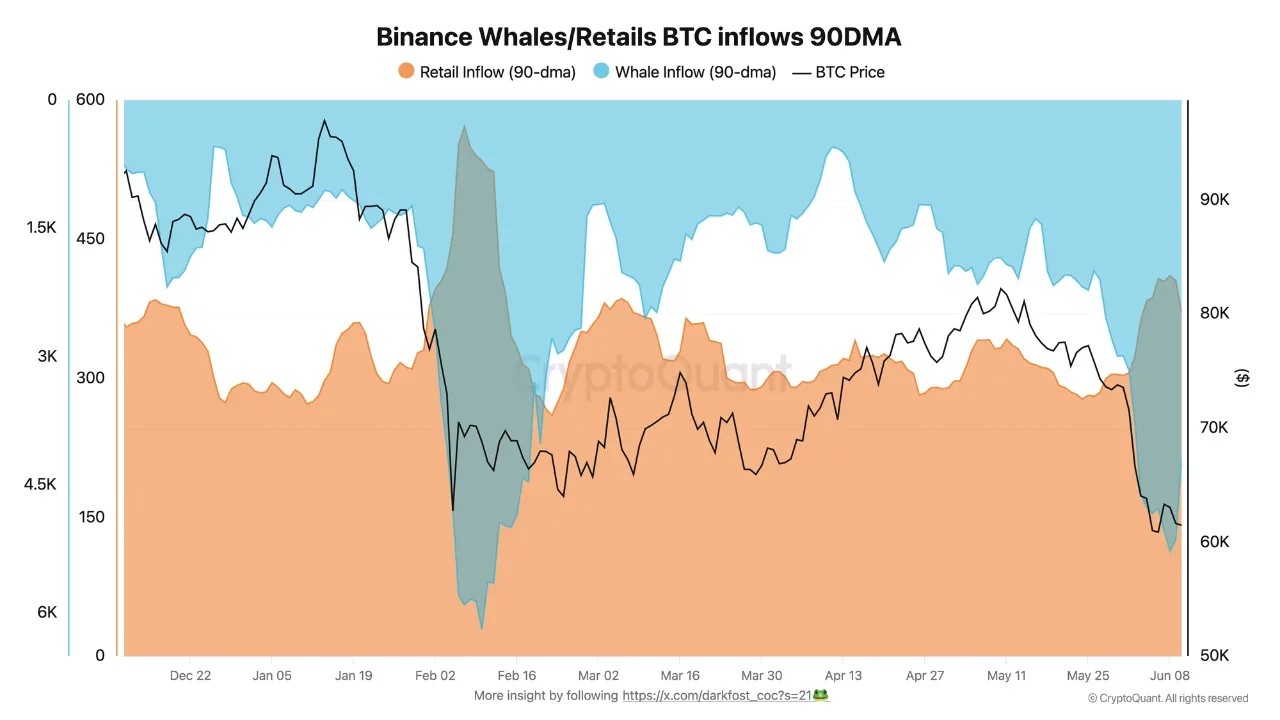
CryptoQuant analyst Darkfost also said that whales and retail traders have increased. $BTC influx into Binance as the price fell below $60,000. Whale influxes reached an average of 5,280 $BTC over 90 days, while retail entries reached around 410 $BTC.
These exchange flows can show fear, as coins moving to exchanges are often easier to sell. Darkfost compared this behavior with that of early February, when similar entries appeared during another move below $60,000.

For now, the key market level remains the $60,000 zone. Staying above this zone would support the idea that the latest sell-off has been contained.
A stronger recovery would require Bitcoin to recover $65,000 and then gain momentum towards $68,000 to $70,000. Until then, the rebound remains a relief in a fragile market.