
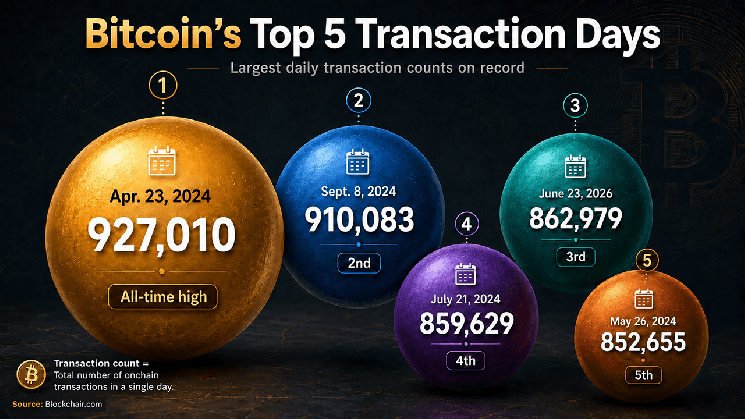
The count is only two days behind 2024, on April 23 with 927,010 transactions and September 8 with 910,083 transactions, according to Blockchair’s daily transaction statistics. No day in 2025 was within reach of this range. The June 23 publication constitutes the clearest signal to date. BitcoinThe onchain activity is returning to its most active historical territory.
What Record Day Means
A higher number of transactions reflects a greater number of wallets moving funds across the base blockchain layer. This may indicate foreign exchange settlement activity, a minor and whale movement, or a broader increase in commercial and institutional use of the network itself, distinct from price action on any single exchange.
Traders who follow on-chain data have a new data point to weigh. June 23 is above every day recorded in 2025 and all but four days recorded in 2024, a year that recorded 51 days above 700,000 transactions. This places 2026 in a range Bitcoin hasn’t been busy on a sustained basis since its record year.
- June 23, 2026: 862,979 transactions, the third highest day on record.
- April 23, 2024: 927,010 transactions, the highest ever.
- September 8, 2024: 910,083 transactions, second highest day.
- July 21, 2024: 859,629 transactions, now pushed back to fourth place.
- May 26, 2024: 852,655 transactions, now fifth.
A rebound built month after month
The June 23 peak did not happen in isolation. Figures from Blockchair show a steady rise during the first half of 2026. January saw an average of 390,877 transactions per day, with a median of 383,148. This average increased to 468,602 in February, 475,075 in March, 560,212 in April, 645,363 in May, and 651,655 in June.
From January to June, the monthly average increased by 66.7%, while the monthly average increased by 64.2% over the same period. An increasing base over six consecutive months indicates a broader increase in network usage, not a single unusual day.
Through July 5, 2026, the median number of daily transactions for the year stands at 529,623, with an average of 533,890. Both figures already exceed the median and average for the entire year posted in 2024 and 2025. The cumulative total for the year reached 99.3 million transactions over 186 days.
BitcoinMonthly averages for 2026 show the same upward trajectory.
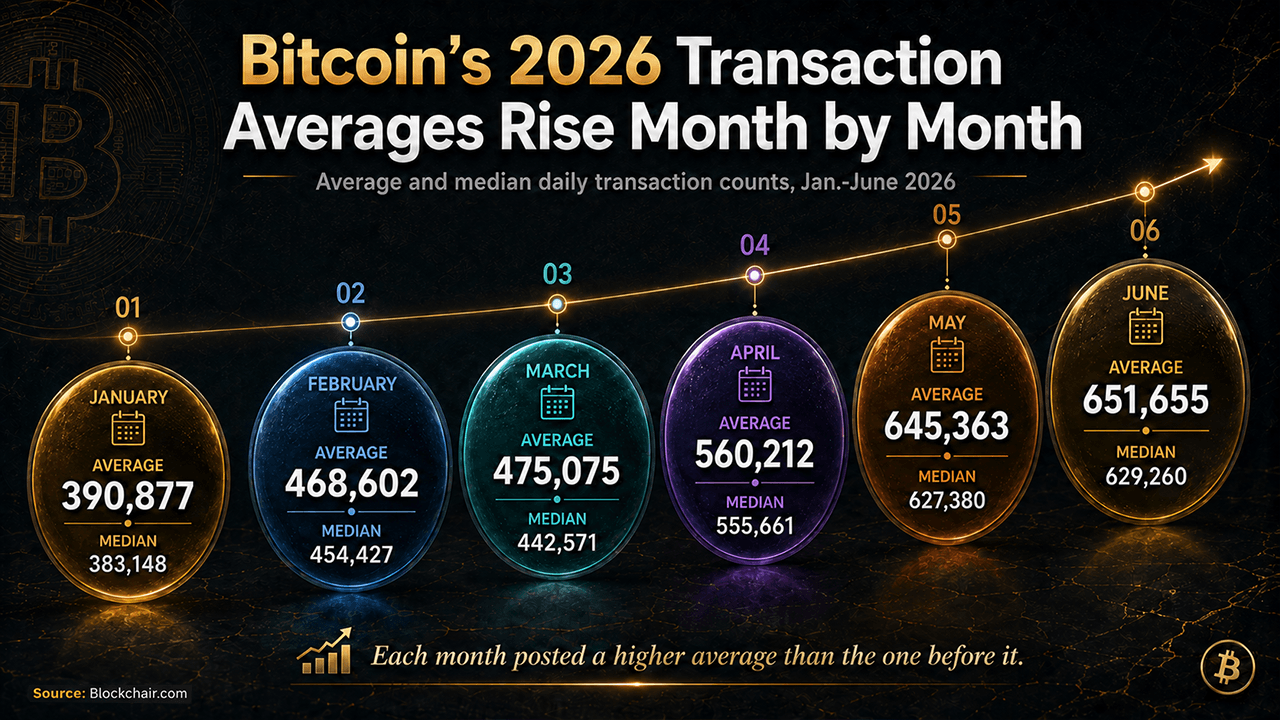

Each month has a higher average than the previous month. This type of steady increase indicates broad network usage rather than a temporary rush of activity tied to a single event.
2025 marked a clear slowdown
Bitcoin’s median number of daily transactions fell to 417,151 in 2025, down 18% from the 2024 median of 508,934. The average fell to 421,184, a decline of 19.8% from the previous year. The total for the full year fell to 153.7 million transactions, almost 38.5 million fewer than the 2024 total.
The calendar year 2025 produced zero days above 700,000 transactions and zero days above 800,000. In contrast, 2024 saw 51 days above 700,000 and 10 days above 800,000. The Bitcoin network continues to process hundreds of thousands of transactions daily throughout 2025, but the entire band activity shifted downward from its busiest days to its weakest sessions.
The weak side of the cast tells the same story. The file recorded 150 days below 400,000 transactions in 2025, compared to 74 in 2024. Twenty of those 2,025 days fell below 300,000 transactions, compared to eight in 2024. The five lowest days in the combined 2025-2026 window all landed in 2025, with the low being reached on June 1 2025, to 256,072 transactions.
June 2026 Doubles June 2025
The comparison from one year to the next makes the picture even more precise. As of June 2025, there were an average of 342,866 transactions per day. In June 2026, there was an average of 651,655, a jump of 90.1% in twelve months.
Through July 5, 2026, the average number of transactions is 38.5% higher than the same period in 2025. The 2026 median for this period is 41.6% higher than the 2025 figure. Measuring the same calendar window for both years eliminates the distortion of comparing a partial year with a completed year, and the gap withstands this stricter test.
2024 still holds the record
Bitcoin’s all-time high remains intact. April 23, 2024 produced 927,010 transactions, the largest day in the dataset, followed by September 8, 2024, with 910,083. Two additional days in 2024, July 21 at 859,629 and May 26 at 852,655, round out a top five now shared with June 23, 2026.
Four of the five busiest days on record took place in 2024. That year also saw an annual total of 192.2 million transactions, the highest annual figure in the dataset, spread across a spring, summer and early fall period of repeating days to large number of days.
Where does that leave the second half of 2026
The rebound carries a warning signal worth noting. On July 5, 2026, there were 367,365 transactions recorded, compared to 766,307 the day before, a one-day drop of 398,942, the largest one-day drop during the 2024-2026 window.
The broader figures from early July still hold up despite this drop. The five-day average from July 1-5 stands at 595,193, with a median of 613,353. A single moderate reading on the edge of a short five-day window doesn’t erase six straight months of rising monthly averages.
Threshold counts this view. Bitcoin recorded 59 transaction days of 600,000 or more in 2026 through July 5, compared to just five in all of 2025 and 107 in 2024. This metric captures more than just the rare extreme day. It shows whether high activity has become routine, and according to this indicator, 2026 is already closer to the pace of 2024 than to that of 2025.
If current momentum continues through the second half of the year, 2026 is expected to end much closer to the active range of 2024 than the moderate one of 2025. The daily record high still belongs to 2024. Current activity trends belong to 2026.