


XRP price remains within the confines of a descending parallel channel, a bearish technical formation that began around mid-July.
However, this token, which powers the Ripple ecosystem, managed to buck the trend as crypto outflows reached $446 million last week.
XRP Reverses Trend as Crypto Outflows Hit $446 Million
According to the latest CoinShares report, cryptocurrency outflows reached $446 million last week, slightly less than the $952 million in negative flows seen in the week ending December 20.
However, during the two weeks, XRP managed to reverse the trend, seeing positive fund flows as top assets like Bitcoin and Ethereum saw red flashes.
After recording $62.9 million in positive flows for the week leading up to Christmas, positive flows into XRP reached $70.2 million last week. Meanwhile, Bitcoin and Ethereum saw negative flows of $443 million and $59.3 million, respectively.
Crypto funds are circulating last week. Source: CoinShares
“This suggests that investor sentiment has not yet fully recovered…
James Butterfill, head of research at CoinShares, attributes the positive sentiment seen in XRP and Solana to the launch of their respective ETFs in mid-October.
“Since the ETFs launched in mid-October in the US, they have seen $1.07 billion and $1.34 billion in inflows, respectively, bucking the negative sentiment seen across other assets,” Butterfill added.
Indeed, and as reported by BeInCrypto, XRP ETFs have seen a series of positive flows, likely contributing to the $70 million seen last week.
Technical Pressure Increases as XRP Price Consolidates in a Downtrend
Despite positive flows into XRP-linked funds, Ripple price remains confined in a bearish technical formation, with bearish hands waiting to interact with the price in the event of a slight recovery. On-chain data and charts tell a different story.
As long as the price of XRP remains within the channel boundaries, its value will likely continue its downward trend. A breakout and close below the $1.77 support could pave the way for a decline to $1.50, almost 20% below current levels.
How can it avoid such a fate with more bearish than bullish hands waiting to interact with the price in the event of a slight recovery? Bearish volume profiles (red horizontal bars) show where sellers are located, while green horizontal bars indicate buyer positioning.
The Relative Strength Index (RSI), a momentum indicator, indicates that sellers have the advantage as it remains below 50. It accentuates the corrective phase, flattening after an extended decline, which typically signals a compression of momentum.
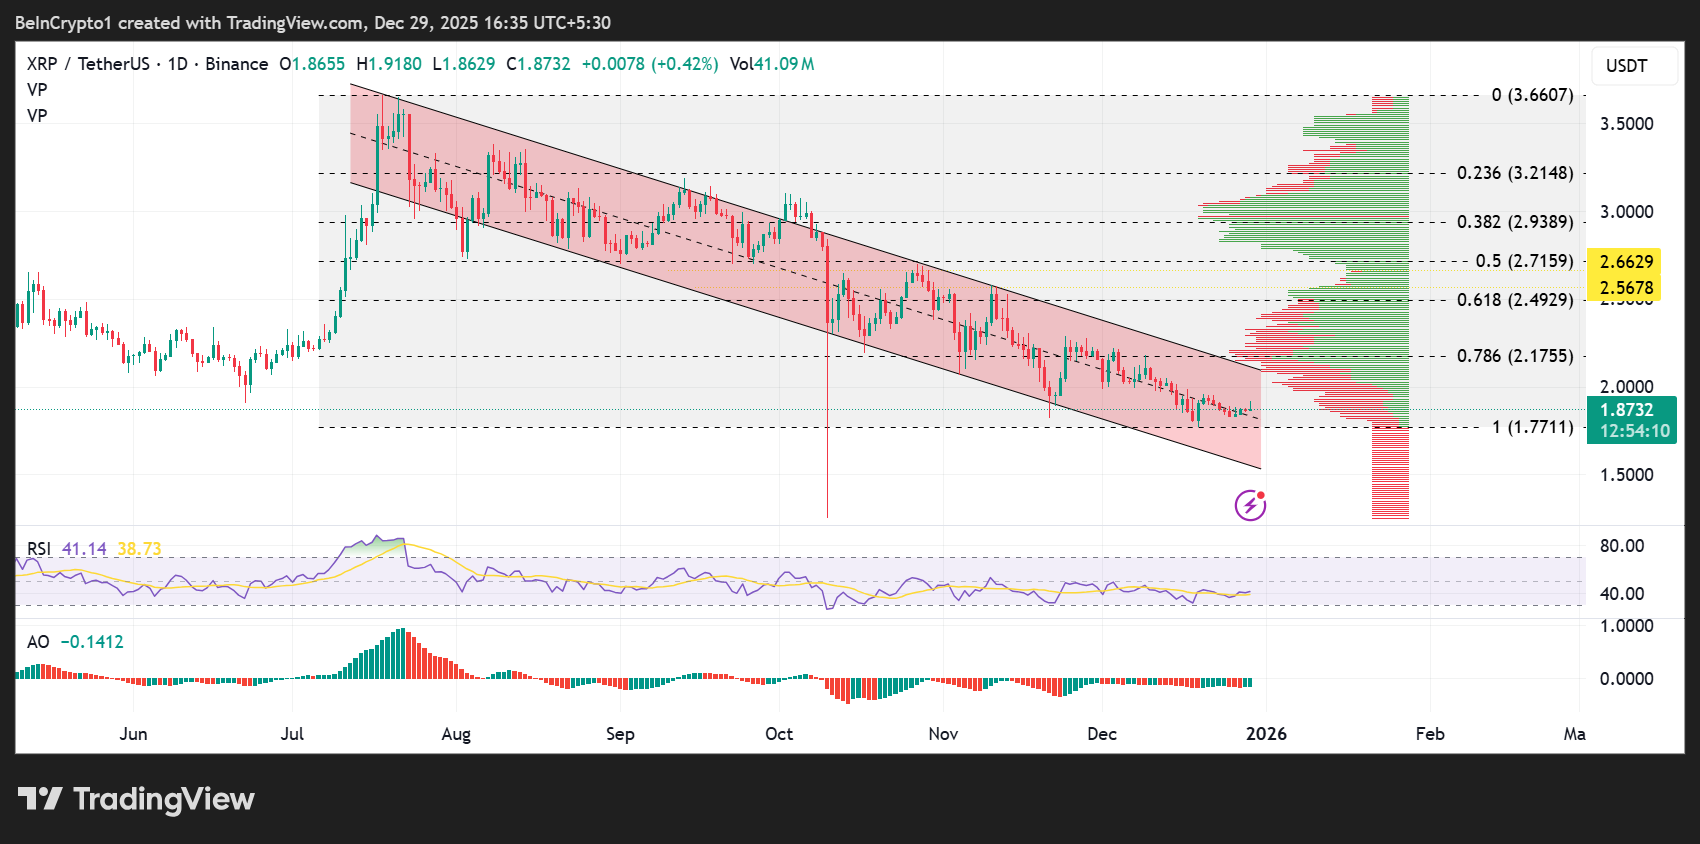
Ripple (XRP) price performance. Source: TradingView
Meanwhile, the Awesome Oscillator is flashing green, but still in negative territory. This means that the bears are losing their aggressiveness, but the bulls have not intervened decisively.
Each minor bounce in the RSI failed to cross the midline, respecting the upper boundary of the descending parallel channel, a sign that the trend remains intact.
So what would be a game changer for the price of XRP? A clear break of the RSI above 50, especially alongside a breakout of the upward channel, would be your first confirmation of a trend change.
Buyers should wait for a breakout and a successful retest of the price above the upper trendline of the channel. Meanwhile, rallies are technically relief bounces.
XRP Price Seems Broken, But Investors Are Quietly Doing the Opposite appeared first on BeInCrypto.